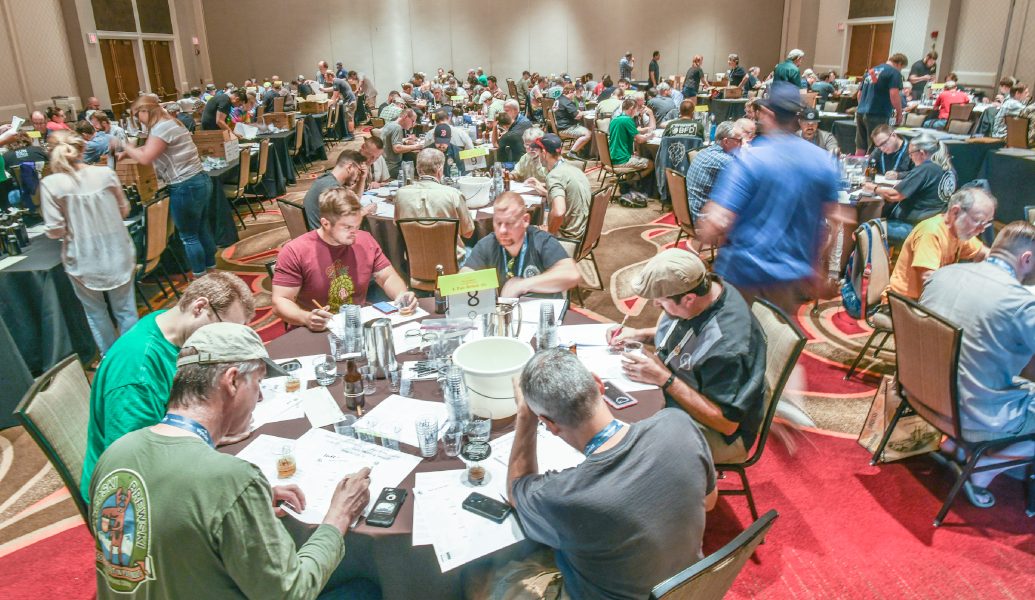
It’s August, the time of year to think about which refreshing summer fruit beers to cool off with, whether rosé beers should be year-round, and what the difference is between low-calorie and low-alcohol beer. It’s also time for a recap of the National Homebrew Competition (NHC), the largest beer competition in the world! You can find the full list of 2019 NHC winners here.
I’ll begin with the caveat that the geographic data presented here is what we have when we open the competition, not the data at the end of the competition. The specific numbers may not be 100 percent accurate (e.g. some people may have moved), but the trends should nonetheless closely reflect reality. The category data do not directly compare one year to the next because of changes in groupings, but we can still learn much from analyzing it.
States
First, let’s dispel a common myth: that some states have an advantage at NHC due to their geographic locations. As we see this year, there is no relationship between distance from the event and the likelihood of winning. The best predictor of the number of medals a state wins is how many beers were entered from that state, without considering which categories entries were entered in to.
Here are the top five states by entrant and entry count.
| State | Entrants | Entries |
| California | 585 | 1585 |
| Colorado | 244 | 544 |
| New York | 194 | 422 |
| Texas | 171 | 435 |
| Pennsylvania | 170 | 417 |
It’s reasonable to conclude that the top five states for entrants and entry count would win the most medals, as they’d have the greatest odds of winning based on percentage of entries in the competition. However, we see that number of entries does not necessarily correlate to number of medals.
Here are the top five states by medal count. While some of the top entry count states made the cut, you’ll notice a few did not:
| State | Medals | % of Total Medals |
| California | 17 (8 G, 2 S , 7 B) | 16.7% |
| New York | 6 (1 G, 4 S, 1 B) | 5.9% |
| Ohio | 6 (3 G, 2 S, 1 B) | 5.9% |
| Arizona | 6 (1 G, 3 S, 1 B) | 5.9% |
| Pennsylvania & Washington (tie) |
|
4.9% (each) |
Key: G=Gold, S=Silver, B=Bronze
For these leading states, it’s clear that medals are geographically widely distributed across the country. No top-entry-count state greatly over-performed this year. California, New York, and Pennsylvania accounted for 26.4 percent of all NHC entries and took home 27.5 percent of all NHC medals.
Who did over-perform? It’s worth highlighting Arizona. Arizona ranked 26th in overall entry count with 101 entries, accounting for just 1.1 percent of all NHC entries. However, Arizona homebrewers took home 5.88 percent of all NHC medals. That’s more than all other states but three.
Although number of entries broadly translates into number of medals won, you’ll notice that Colorado (4 medals) and Texas (3 medals) did not make the cut, while Ohio, Arizona, and Washington all nudged their way into the top five. Quality still wins in a battle of attrition, so don’t presume that larger homebrewing states will necessarily win, or that states geographically nearer the Final Round will have an advantage.
Geography of Entries
OK, we’ve established that number of entries broadly translates into number of medals won. But what does regional participation look like?
The graph below shows NHC entries by region compared to AHA membership around the country. I’ve used the 10 standard Federal regions as a basis for dividing up the states, with International added as an 11th region.
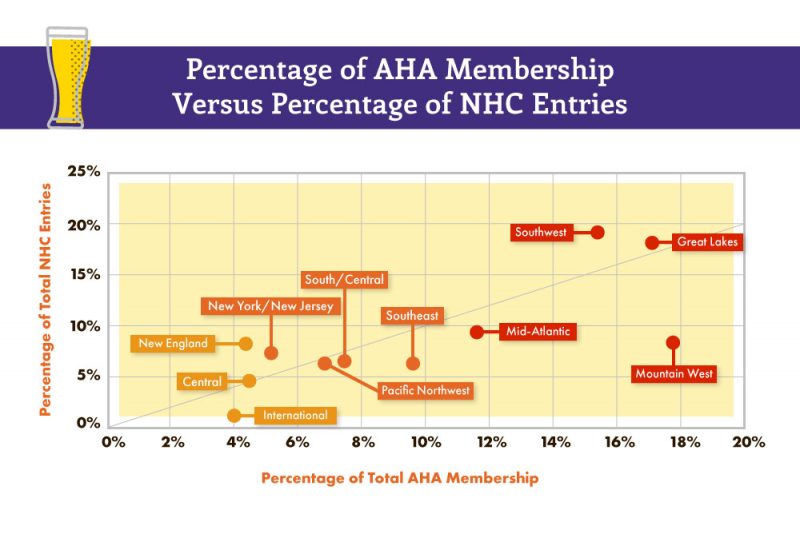
To me, this reveals a couple of things. First, NHC tends to draw entrants from all parts of the country in line with the number of AHA members in that region. That said, a few regions participate more than you’d expect based on the number of members in that region, and others participate a bit less. Specifically, the Southeast and Mountain West tend to send fewer entries relative to their percentage of AHA membership, whereas the Southwest and Great Lakes send more. Here are the numbers.
| Region | Medals Won | Total Entries | % of Entries | % of AHA Membership |
| 1. New England | 6 | 756 | 8.2% | 4.4% |
| 2. New York/New Jersey | 7 | 682 | 7.4% | 5.0% |
| 3. Mid-Atlantic | 10 | 873 | 9.5% | 11.6% |
| 4. Southeast | 5 | 1021 | 11.1% | 9.7% |
| 5. Great Lakes | 16 | 1657 | 18.1% | 17.2% |
| 6. South Central | 4 | 575 | 6.3% | 7.5% |
| 7. Central | 10 | 418 | 4.6% | 4.5% |
| 8. Mountain West | 6 | 756 | 8.3% | 17.9% |
| 9. Southwest | 23 | 1772 | 19.2% | 15.4% |
| 10. Pacific Northwest | 7 | 595 | 6.5% | 6.9% |
| 11. International | 4 | 84 | 0.9% | 4% |
Entry Counts
As a final area to analyze, I looked at overall entry counts across the competition over the last three years. Despite the fact that judging locations, the Homebrew Con location, and NHC category groupings change every year, it’s still valuable to examine.
First, I broke out the total entry count by region.
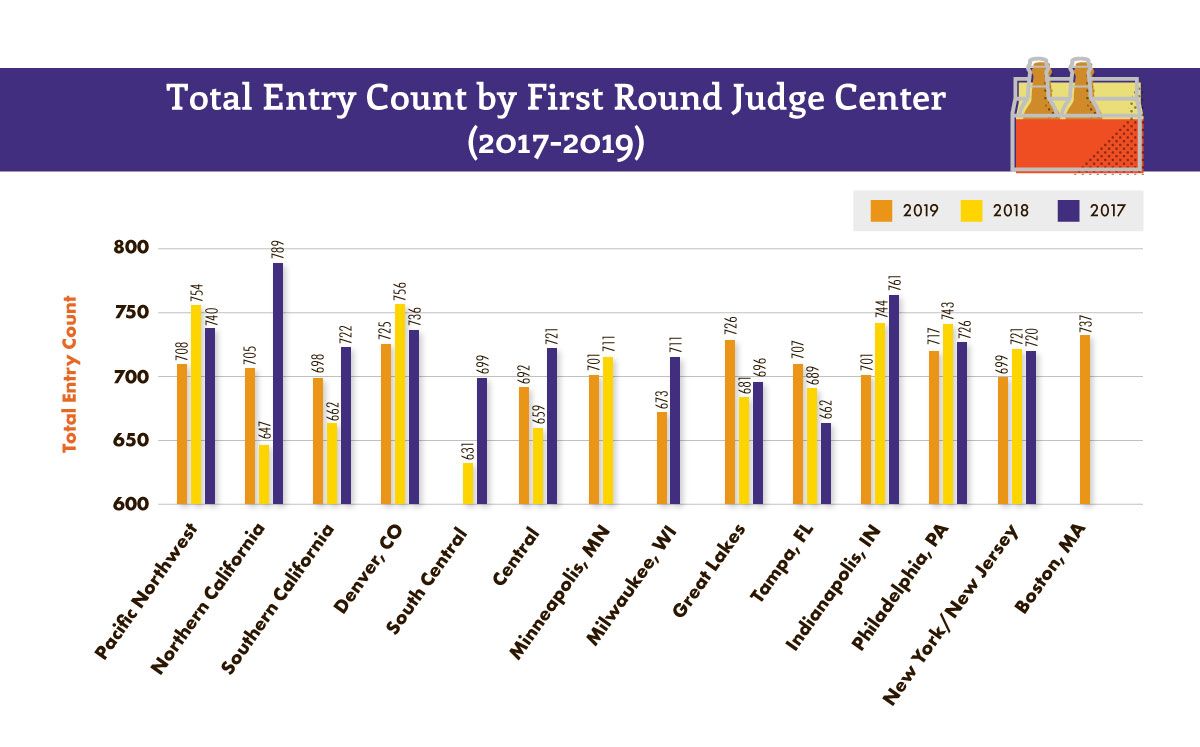
What stands out here is that there is solid representation across all First-Round judge centers. There are a few reasons why some judge centers tend to attract more entries than others:
- AHA membership concentration
- First-time host judge center
- Proximity to Homebrew Con
- Health of homebrew community
All but three sites have had more than 650 entries in the past three years across 12 or 13 regions. That’s a three-year average of 708 entries per judge center per year.
You’ll notice a few missing data points. For example, there was no South Central site in 2019, Minneapolis did not host a First-Round judge center in 2017 because it was the host city for Homebrew Con that year, and Milwaukee has alternated with Chicago as a First-Round judge center. Boston first hosted a judge center in 2019, so we don’t have any other data for that area.
A key takeaway is that the Philadelphia and New York/New Jersey sites didn’t experience a substantial drop in entry count by adding a judge center (Boston) in close proximity.
Categories
Entrants always want to know style category data to improve their odds of advancing and medaling. Below is a bird’s eye view of the NHC category count from 2017 through 2019:
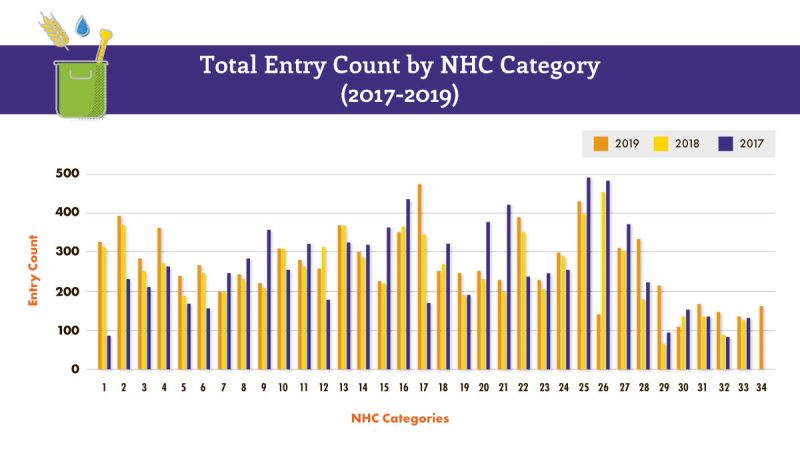
Average Category Count by year:
- 2017: 261
- 2018: 255
- 2019: 270
The categories change each year, so this isn’t an apples-to-apples comparison, but it still helps illustrate trends.
*Break Out of Entry Count by Categories (2017-2019)*
Two category trends stand out in particular: American Pale Beer has more than tripled from 2017 to 2019, and Specialty IPA has seen 250 percent growth, likely from the addition of New England IPA as a provisional style. Because the groupings within categories have changed so much over the past three years, we’ve provided a breakdown of categories by year and their entry counts for a more in-depth analysis.
One broader trend: if you look at categories containing lager style beers, entries are up 68 percent from 2017 to 2019, with a lager category breaking through in the top five largest categories of the competition in 2019. Mead and cider entries are up 21 percent from 2017 to 2019 as well, and all IPAs (American & Specialty) continue to dominate overall entry count, accounting for 9 percent of all competition entries in 2019.
Will we continue to see these trends rise or see a different story in 2020? It’s hard to predict, but I suspect with new and more affordable technologies, access to quality ingredients, and continued education, we’ll see lager-style beers and mead and cider entry counts continue to rise.
Conclusions
So, what does this all mean? For one, it means to win a medal in the National Homebrew Competition is difficult—very difficult. Just over 1 percent of all entries win a medal. Winning a medal has the same odds as the Cincinnati Bengals winning Super Bowl LIV (nothing against the Bengals or their fan base, despite my being from Pittsburgh). Those are really towering odds to overcome, and they don’t account for intangibles like shipping issues and category size either. For example, the chance of winning a medal in Specialty IPA is 0.6 percent.
For the major awards like Homebrewer of the Year (the best beer in the entire competition), the odds of winning are a little better than hitting a hole-in-one. My guess is not many who read this have ever hit a hole-in-one, so you understand how hard it is to do.
Why does all this matter? Because the National Homebrew Competition showcases the skill, knowledge, and innovation of the AHA membership and exemplifies how serious homebrewing is. Entrants dedicate hours upon hours, year after year, adjusting, reevaluating, and improving their homebrew.
Some might question the significance of medaling in a homebrew competition. However, it takes a herculean effort to win a medal at NHC. The caliber and quality of entries rival those of commercial beer, and many entrants use this competition as a launching pad for a professional career. The National Homebrew Competition is in a league of its own, and the few who have medaled over the years are among some of the greatest brewers in the world. I’ll cheers to that!
* * *
American Homebrewers Association competition coordinator John Moorhead is director of the National Homebrew Competition, coordinates the Great American Beer Festival® Pro-Am Competition and the Capitol Hill Staff Homebrew Competition, assists with homebrew legislative efforts, and writes for HomebrewersAssociation.org.


Share Post